Previous work in this series has addressed student loan default rates, but default is an extreme event. To build a more comprehensive understanding of loan repayment, this post reports student loan repayment rates at Wisconsin schools to better understand the lifecycle of loan repayment.
The U.S. Department of Education reports student loan repayment rates for colleges via the College Scorecard. This rate measures the percent of undergraduate borrowers in a given repayment cohort who have reduced the principal balance on their federal student loans by at least one dollar. This rate includes borrowers with federal undergraduate loans (not Parent PLUS, Perkins, or Grad PLUS), with repayment measured 1, 3, 5, or 7 years after a borrower leaves school. Because this metric focuses on identifying borrowers who are reducing balances, repayment rates are often viewed as a supplement to the federal Cohort Default Rate (CDR).
The interactive figure below shows repayment rates for Wisconsin colleges and universities, disaggregated by sector. Users can select 1, 3, 5, or 7-year repayment rates for various repayment cohorts, and can examine differences by Pell Grant recipients, first-generation students, completers and non-completers.
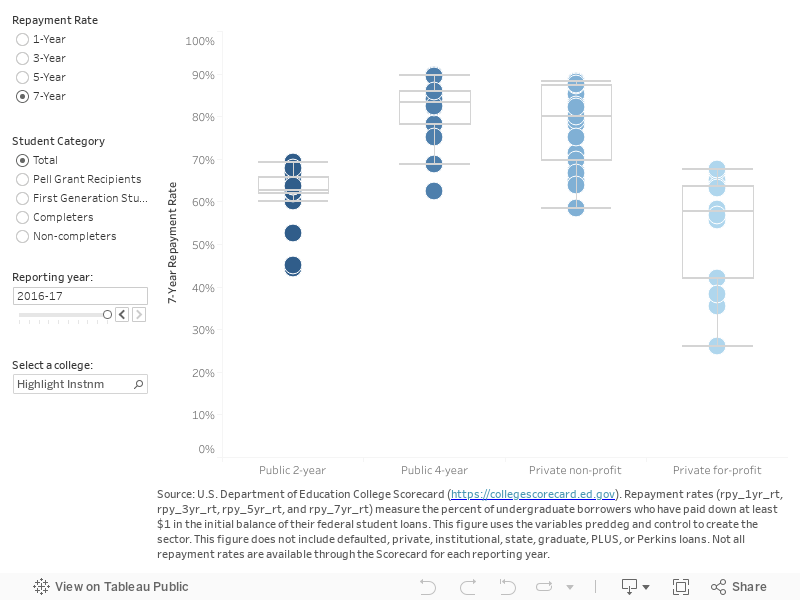
The data tool shows how repayment rates generally improve over time. For example, when we follow borrowers just one year into repayment, their repayment rate ranges from 17% to 83% for the most recent cohort of borrowers. But when we look at borrowers seven years into repayment, their rates are higher, now ranging from 24% to 90%. This is likely because borrowers have had more time since leaving school to make progress on repaying loans; in contrast, many borrowers struggle with repayment in the years immediately after leaving school.
Repayment rates also vary across sector, where median repayment rates for public and non-profit four-year institutions are typically 20 to 30 percentage points higher than those of public two-year and for-profit institutions.
When exploring repayment for specific student subgroups, the chart shows Pell recipients’ repayment rates are typically between 5 to 10 percentage points lower than those for all students. Likewise, students who complete their degrees tend to have higher repayment rates than those who drop out.
Using College Scorecard data comes with some limitations. First, repayment rate calculations exclude graduate school debt, loans made to parents of undergraduates (commonly known as PLUS), Perkins loans, and nonfederal loans. As a result, the repayment rates presented here do not reflect the full range of repayment experiences for all borrowers. Additionally, data are suppressed when colleges have fewer than 30 borrowers in repayment, resulting in missing data for some institutions. And finally, rates are not disaggregated by repayment plans (e.g., income-driven versus standard), so we are unable to tell whether these plans make a difference for repayment outcomes.
In this post, we have briefly covered the trends and differences in student loan repayment rates for Wisconsin institutions. Because some borrowers use repayment plans that tie their monthly payments to income, or extend the time horizon for loan repayment, these figures can vary widely for borrowers even if they are in good standing on their loans, a phenomenon that is not discussed in detail here.